Disease, Epidemics and Vaccination Effectiveness through Agent Based Modelling
Role
During my undergraduate degree, I took a course called ENGG*3130-Modelling Complex Systems. This course focused on looking at complex global and socioeconomic issues using computational modelling in Python. As part of the course, I was involved in a group of three to model a complex issue using the techniques discussed in the course.
My contribution towards the project was helping with the design of the model as well as programming most of the model in Python. I also partially contributed towards programming the visualizations.
Problem
The issue my group and I tackled was to model how disease spreads and vaccine effectiveness through the use of agent based modelling. Agent based modelling involves modelling a system using a collection of autonomous entities interacting with other agents and the surrounding environment. The goal of the model was to mimic the movements of people as well as disease spread, and to see the effect vaccination would have on the population.
Solution
There are two main components to the model; the environment and the agents.
The environment consists of a grid, where each cell can be empty or occupied by an agent. The environment also stores information about the disease’s behaviour, such as the distance the disease can spread from one person to another. The environment also keeps track of all of the people in the model and how many have passed away.
The agents in the model represent the people in society. People are able to move around to a spot that is not occupied and is within viewing distance, and they can be vaccinated or not vaccinated as well as be sick, healthy, or dead. A person with the disease can spread it to other nearby people based on how far it can spread, the infection rate of the disease, and if that person is vaccinated or not.
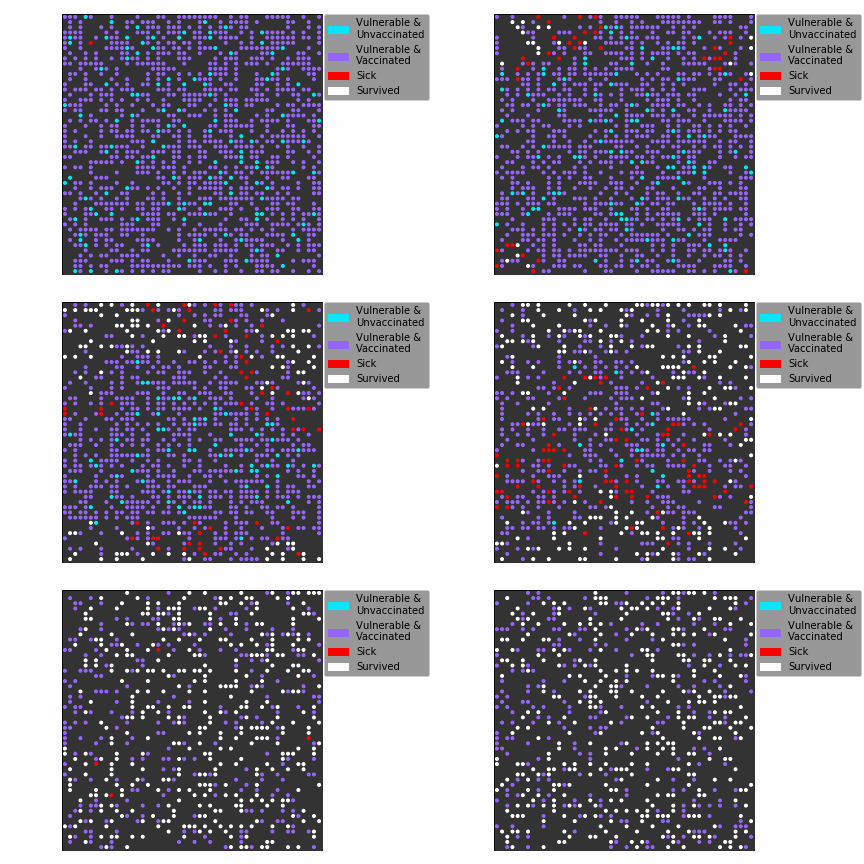
Each person stores the state that they are in. A person can be in one of four different states. Vulnerable & unvaccinated is the state a person is in when they have not caught the disease before and have not been vaccinated. Vulnerable & vaccinated is the state a person is in when they have not caught the disease before and have been vaccinated. Sick is the state a person is in when they are currently sick with the disease. Survived is the state a person is in when they have had the disease and successfully fight it off. This model assumes that once a person has caught the disease and is no longer sick, they cannot catch the disease again. If a person ends up dying because of the disease, the person is removed from the model and the death is recorded as well as which time stamp it occurred.
The model takes consecutive steps in time. During each step, two different parts of the model are addressed. First, for every person in the model, the surrounding people are observed to see if any of them are sick and could spread the disease based on different parameters such as if the person is vaccinated, the infection rate, and the range a person could affect another person. Additionally, any sick person has a chance of dying while being infected, which is done at this time as well. These steps update the state of the people in the model. Once this has finished, every person moves to a new position. After this has completed the model takes another step, and this is continued until the specified number of steps have been taken.
The figure below shows the model at the beginning of the simulation in the left subplot, at step 10 in the center subplot, and at step 25 in the right subplot. During the first step, a single person will begin by being sick. As the simulation for the model progresses, the disease spreads and causes more people to become sick or pass away. The simulation ends once there are no more people sick with the disease to continue its spread.
A larger simulation can be seen in the animation below.

A series of simulations were executed with varying vaccination rates among the population to test herd immunity. For every simulation run, the same disease parameters were used and the only parameter being adjusted is the vaccination rate. The method used to evaluate how well the vaccination rate keeps the whole population healthy is to track the amount of people still alive after each step of the simulation. The following figures show how the vaccination rate affects the number of people alive by the end of the simulation. From these simulations it can be seen that for this particular disease, the number of people who die as a result of the disease starts to increase drastically when the vaccination rate decreases to be below 88%. This means that the vaccination rate should be at least 88% to ensure herd immunity is present.
Impact
This project was completed and delivered on time. The model was able to successfully simulate various different diseases and vaccines based on parameters a user can change to their desired value. While the model was developed before the COVID-19 pandemic, it could be used to model this disease and the various vaccines that have been developed for it.
Code/Demo/Further Information
The project can be found in my GitHub profile or by using this link: disease-agent-model. The project was done in a Jupyter Notebook and the visualizations and cell outputs can be seen in the repository.


